I don’t remember when I came across “The Visual Display of Quantitative Information” by Edward R.Tufte1, but I remember that I was fascinated by it and read it in one swoop. Moreover, I just wanted to do cool visualisations. However, at that time there was no need for it.
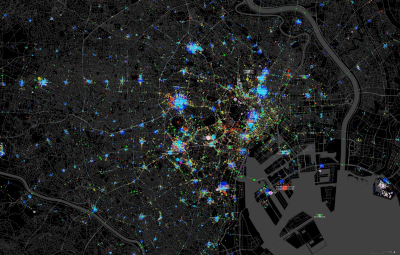
Sometime in the early nineties (I believe), I saw a short film by a Japanese computer graphics company visualising all data available at that time about Tokyo. I was just fascinated by it and just wanted to do that. Still, at that time there was no real need for it. At least not in Germany.
Fast forward, another Edward Tufte book and much more cool things over the time, I found myself at a crossroad. Do I take the blue pill or the red pill? Because I can’t remember which tablet does what, I decided to take some time off to figure out what I would love to do next.
So here I am, rediscovering my fascination for data and visualisation. Looking forward to using my experience in computer graphics and combine it with the newly learned knowledge.

